Chapter 1 Motivation
“Earthquakes are equally as likely to occur in the morning or the evening” Link 1
In September of 2016, a scientific paper was published that reported a small relationship between the phase of the moon and a particular set of earthquakes. This report was vastly overblown by many commenting on the internet into a generalised “the moon causes earthquakes”. To cut through some of the hype, I thought I would write a satirical piece focusing on the sun (not expecting to find anything); I could then pare down the data until I got a result and thus demonstrate how conclusions can be overblown. This is because even given the small influence of the moon on selected fault lines, as of October 2016, there was no evidence for a general link between astronomical activity and earthquakes. Earthquakes were seen as a subsurface process of internal faults and pressures.
Even in satire, I like to be thorough. I downloaded 5 full solar years of earthquake data for New Zealand from the Geonet earthquake database Link 1. Geonet, the official home of New Zealand earthquake data, provides a publicly accessible database of earthquake events. Through a web form visitors can generate a database query with various possible added filters, and either download earthquake information through a web browser or use the query string with programs that can download files from the internet. For large amounts of data, the database separates the queries into blocks of 20,000 earthquakes to avoid system strain.
As the amount of day and night varies within a year, a full year avoids biases created by only downloading earthquakes in a narrow time range. Downloading five years was to avoid biases created by earthquake swarms occurring in a single year. As five years meant several queries of the database, I added a step to remove duplicates to avoid any confusion over whether the dates marking each range were inclusive or exclusive. Since I made my download in October 2016, the five-year range was from the start of October 2011 to the end of September 2016.
After downloading more than 100,000 earthquakes for this 5 year period for the New Zealand region, I calculated which hour of the day, in Coordinated Universal Time (UTC), each earthquake took place in. Then I made a basic graph to get a general feeling for the data. I expected a fairly flat line with a little random fluctuation, as there was no reason to expect any real differences.
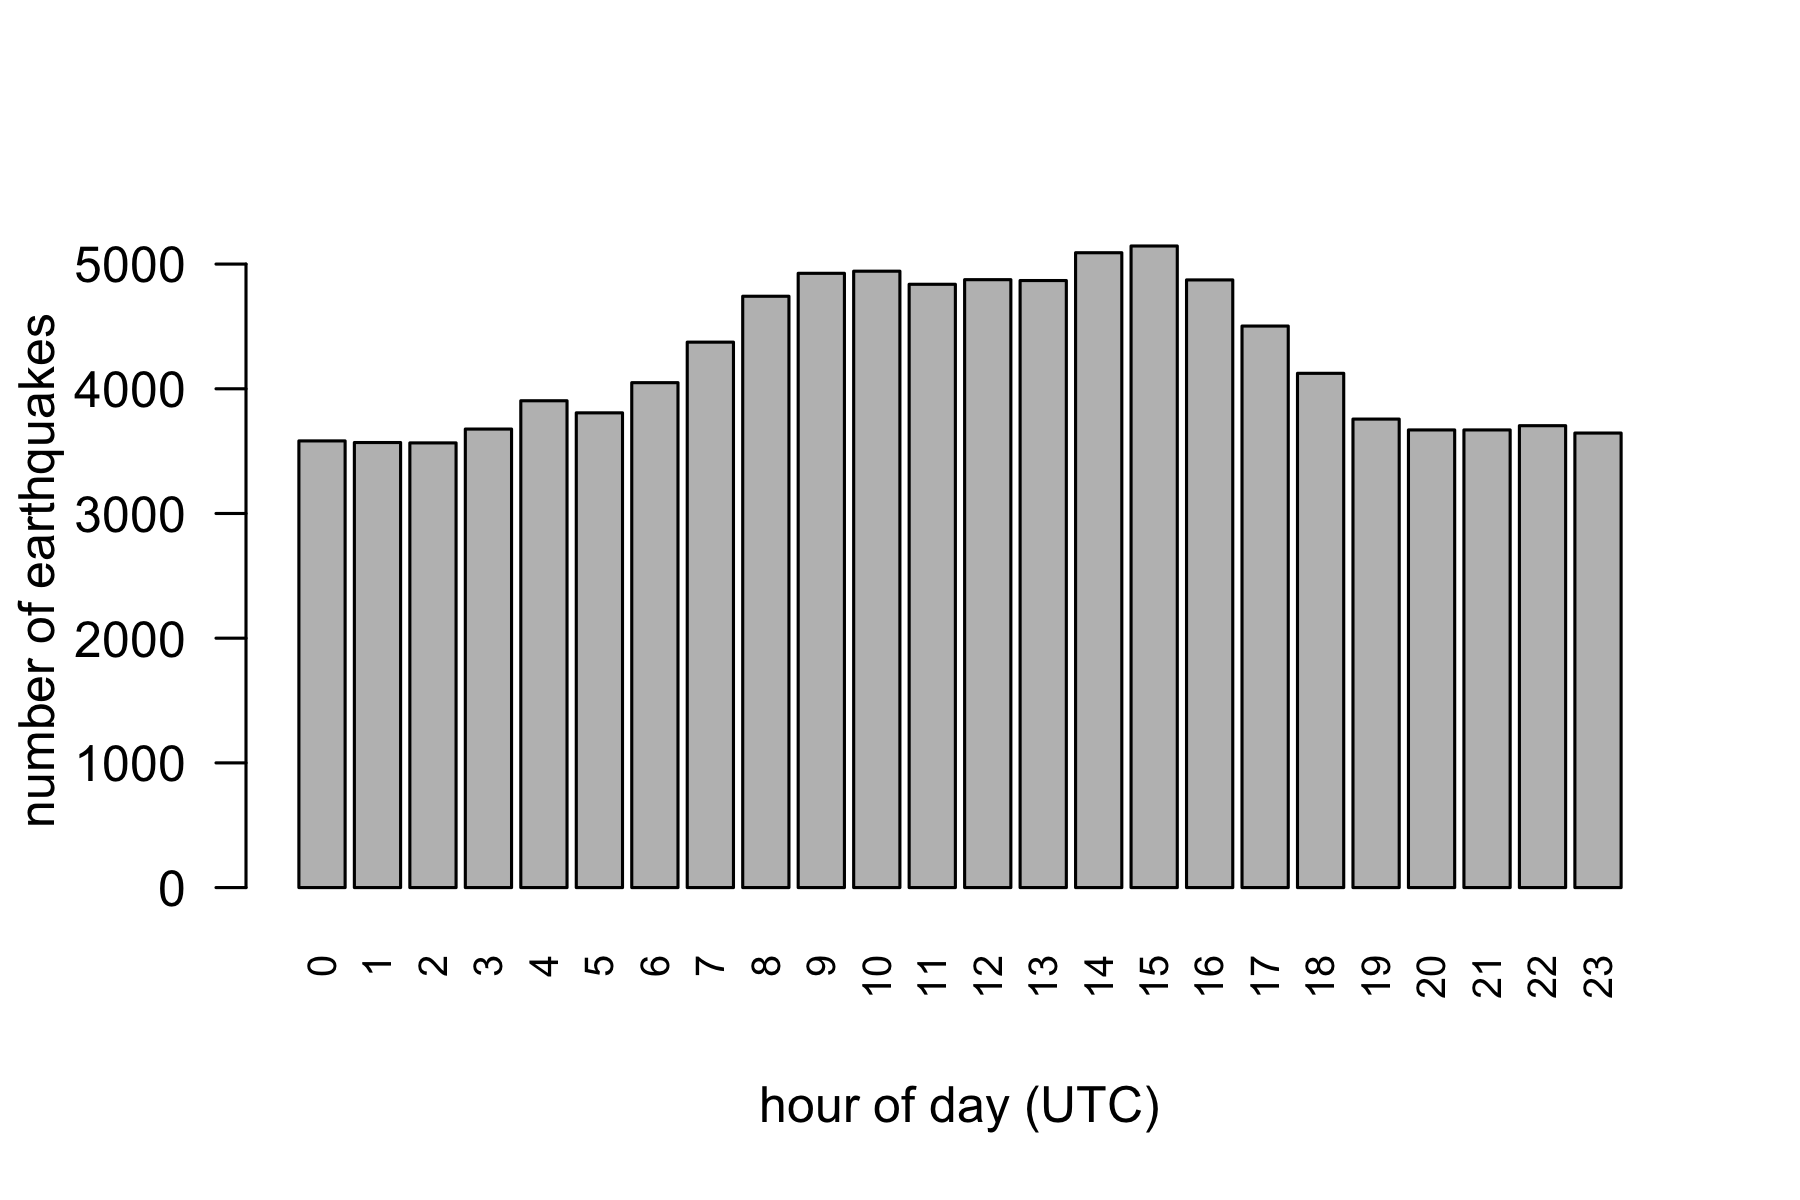
Figure 1.1: New Zealand Earthquakes by hour (UTC)
The results shocked me. Not only was there a visible difference of thousands of earthquakes, the difference was consistent for both the night and day. Both of these things were radically different to the understanding of how earthquakes behaved. The size of the differences was more than would be expected, and the consistency of the differences between night and day showed that it was not random. Since night in New Zealand falls approximately after 7 and before 19 hours, this meant that around 56685 of the 101902 earthquakes occurred in approximate night hours; to put it another way, with 45217 earthquakes occurring in day hours, 25 % more earthquakes occurred at night than in the day.
If the occurrence of earthquakes is not influenced by the sun - as was generally believed to be the case - then the chance of getting such a large difference between night and day over so many earthquakes was too small for the computer to accurately calculate. However, for those happy with approximate figures, it is somewhere in the order of a p-value of:
0.000000000000000000000000000000000000000000000000000000000000000000
0000000000000000000000000000000000000000000000000000000000000000000
0000000000000000000000000000000000000000000000000000000000000000000
0000000000000000000000000000000000000000000000000000000000000000000
00000000000000000000000000000000000000000000000000000001
I could also express the odds of seeing these results by chance given no true night/day effect as a bit less than 1 in 3 googols.
This result was really dramatic, like seeing something fall upwards instead of downwards- if my understanding of the area was correct this result should have been impossible. Once I recovered from the shock of encountering something so unlikely compared to established knowledge, instead of writing a short satirical piece, I had a significant mystery that needed explaining. This book is the account of working through an analysis of that mystery.
1.1 Formal Statement
New Zealand earthquake frequency shows features inconsistent with the established idea of earthquakes being equally likely in the day and night.
1.2 Links
1 - Can the position of the moon or the planets affect seismicity? Are there more earthquakes in the morning/in the evening/at a certain time of the month? (2016) U.S. Department of the Interior |U.S. Geological Survey |DOI Inspector General URL: www2.usgs.gov/faq/categories/9827/3354
2 - Geonet Earthquake Database quakesearch: http://quakesearch.geonet.org.nz Description of Geonet Database search output: http://info.geonet.org.nz/display/appdata/Catalogue+Output
1.3 Chapter Code
## ----setup, include=FALSE------------------------------------------------
knitr::opts_chunk$set(echo = FALSE)
knitr::opts_chunk$set(warnings=FALSE)
knitr::opts_chunk$set(errors=FALSE)
knitr::opts_chunk$set(message=FALSE)
knitr::opts_chunk$set(dpi = 150)
knitr::opts_chunk$set(fig.width =  6)
knitr::opts_chunk$set(fig.height =  4)

## ------------------------------------------------------------------------
library(dplyr)
library(lubridate)

Sys.setenv(TZ = "UTC")


## ------------------------------------------------------------------------

#if it doesn't exist, create an earthquake datasets folder
if(!dir.exists("eqdata")){
  dir.create("eqdata")
}

#if the data file doesn't exist, create it
if(!file.exists("eqdata/eqnz_raw.RData")){
  #bit1 & 2 are a hack to fit things on a single line
  bit1 <- "http://quakesearch.geonet.org.nz/csv?"
  bit2 <- "bbox=163.03711,-49.32512,182.41699,-32.47270&"
  e1 <-
    read.csv(paste0(bit1,bit2,"startdate=2015-09-01&enddate=2016-09-01"),
      stringsAsFactors = FALSE
    )
  e2 <-
    read.csv(paste0(bit1,bit2,"startdate=2014-08-01&enddate=2015-09-01"),
      stringsAsFactors = FALSE
    )
  e3 <-
    read.csv(paste0(bit1,bit2,"startdate=2013-09-01&enddate=2014-08-01"),
      stringsAsFactors = FALSE
    )
  e4 <-
    read.csv(paste0(bit1,bit2,"startdate=2012-10-01&enddate=2013-09-01"),
      stringsAsFactors = FALSE
    )
  e5 <-
    read.csv(paste0(bit1,bit2,"startdate=2011-09-01&enddate=2012-10-01"),
      stringsAsFactors = FALSE
    )
  eqnz <- rbind(e1, e2, e3, e4, e5)
  eqnz$time_UTC <-
    as.POSIXct(eqnz$origintime, format = "%Y-%m-%dT%H:%M:%OSZ", tz = "UTC")

  eqnz <-
    eqnz %>% filter(time_UTC >= as.POSIXct("2011-09-01T00:00:00", format =
                                               "%Y-%m-%dT%H:%M:%S", tz = "UTC") &
                      time_UTC < as.POSIXct("2016-09-01T00:00:00", format =
                                              "%Y-%m-%dT%H:%M:%S", tz = "UTC")
    ) %>%
    distinct()  %>% arrange(time_UTC)
  eqnz$eq_hour <- hour(eqnz$time_UTC)
  save(eqnz, file="eqdata/eqnz_raw.RData")
}
# clean down objects from environment for next stage
rm(list=ls())
load("eqdata/eqnz_raw.RData")


## ----fig.cap="New Zealand Earthquakes by hour (UTC)"---------------------
barplot(table(eqnz$eq_hour), cex.names=0.8, las=2, ylab="number of earthquakes",
        xlab="hour of day (UTC)")

## ------------------------------------------------------------------------
# calculate summaries of how many in parts of day
n_night <- sum(eqnz$eq_hour > 7 & eqnz$eq_hour <=19)
n_total <- length(eqnz$eq_hour)
n_day <- n_total - n_night
n_perc_diff <- paste(round(100 *(n_night - n_day) / n_day,0), "%")
p_val = binom.test(n_night,n_total)$p.value