Chapter 3 Key result
As I have now done all the initial processing of the data, I can make a formal statement about the amount of night and day
3.1 Formal Statement
The study data consists of all subsurface earthquake and likely earthquake events of positive magnitude detected within the study area and time period.
The study area is formed by the rectangular area encompassed by -32.47270 degrees latitude north, -49.32512 degrees latitude south, 182.41699 (-177.583) degrees longitude east, and 163.03711 degrees longitude west.
The study time period consists of the 5 full solar years from September 1st 2011 to September 1st 2015.
Of 100279 the events, 56246 occurred at night and 44033 occurred in the day. Night is defined as being when the sun is below the horizon at the time and surface location of the event.
This can be expressed as 56.09 percent of earthquakes occurred at night, or that there are 27.74 percent more earthquakes at night than in the day.
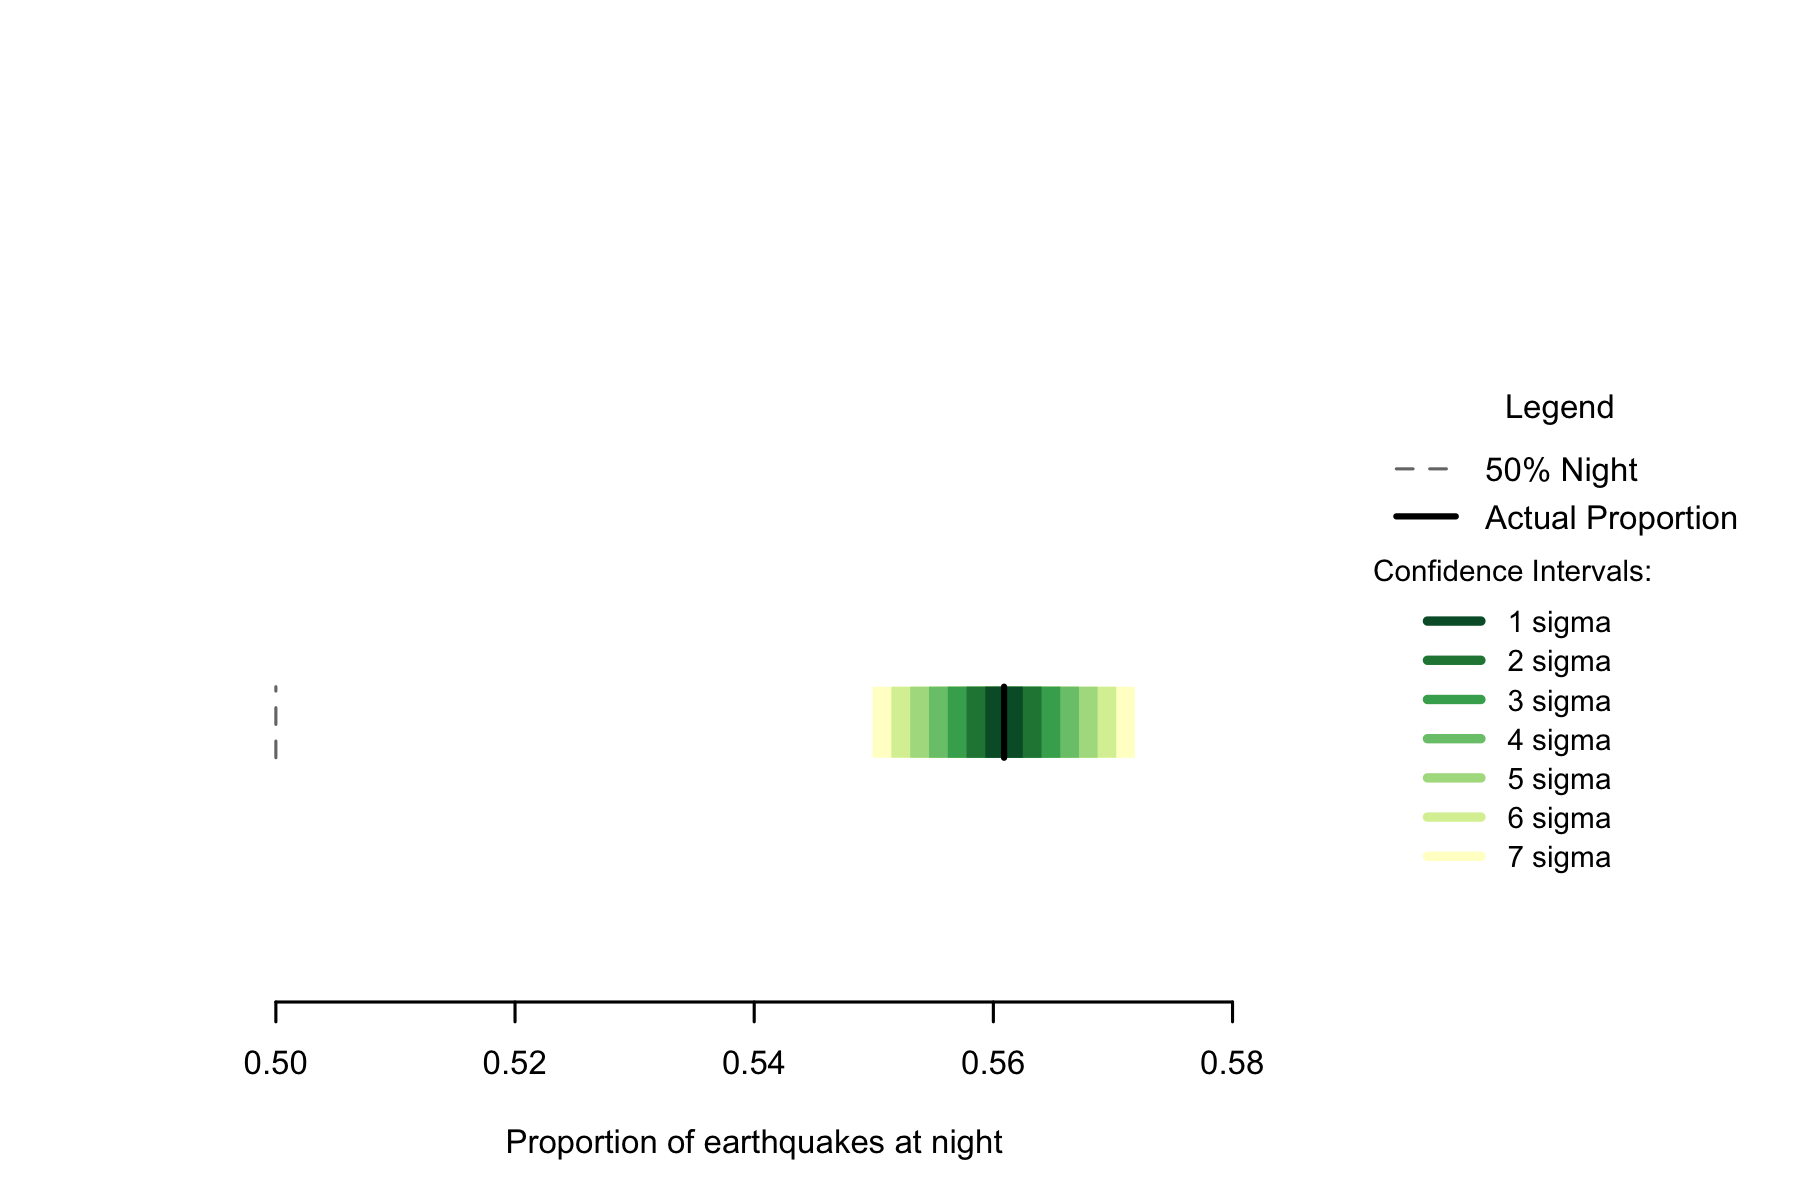
Figure 2.1: Proportion of New Zealand earthquakes occurring at night. n=100279
Given this number of samples and an equal amount of day and night for earthquakes to occur in, if earthquakes are independent events unrelated to the day/night cycle seeing this result by chance is less likely than 1 in a quadrillion (the specific number is too small to be calculated). A seven sigma confidence interval for the proportion of earthquakes occurring at night would be 0.5499 to 0.5718. This confidence interval in no way coincides with 0.5, and using one so large we can confidently say that if earthquakes occur randomly, and there are no biases in our data collection, we would never be seeing this result.
3.2 Chapter Code
## ----setup, include=FALSE------------------------------------------------
knitr::opts_chunk$set(echo = FALSE)
knitr::opts_chunk$set(warnings=FALSE)
knitr::opts_chunk$set(errors=FALSE)
knitr::opts_chunk$set(message=FALSE)
knitr::opts_chunk$set(dpi = 150)
knitr::opts_chunk$set(fig.width =  6)
knitr::opts_chunk$set(fig.height =  4)

## ----c002_libraries------------------------------------------------------
Sys.setenv(TZ = "UTC")
library(binom)
library(dplyr)
# Assumes there is eqnz_processed data created in chapter 2
load("eqdata/eqnz_processed.RData")

## ----c4_002--------------------------------------------------
eqtot <- nrow(eqnz)
eqnight <- sum(eqnz$eq_is_night)
eqday <- sum(!eqnz$eq_is_night)
eqdiff <- eqnight - eqday

## ------------------------------------------------------------------------
bt <- binom.test(eqnight,eqtot, conf.level= .999999999997440)
eq_national <- eqnz

## ---- fig.cap="Proportion of New Zealand earthquakes occurring at night. n=100279"----
### making the basic proportion graph
eq_night = sum(eq_national$eq_is_night)
eq_total = nrow(eq_national)
bands <- rev(c('#ffffcc','#d9f0a3','#addd8e','#78c679','#41ab5d','#238443','#005a32'))
sigmas <- c(0.682689492137086,
            0.954499736103642,
            0.997300203936740,
            0.999936657516334,
            0.999999426696856,
            0.999999998026825,
            0.999999999997440)
lbls <- c(
  "1 sigma", "2 sigma",
  "3 sigma", "4 sigma",
  "5 sigma", "6 sigma",
  "7 sigma")
typs <- c(1,1,1,1,1,1,1)
weights <- c(3,3,3,3,3,3,3)
old_par=par()
conf_steps <- function(x, sigmas=sigmas, night=eq_night, total=eq_total){
  ci_lower <- binom.confint(night, total, method=c("wilson"), conf.level = sigmas[x])[1,5]
  ci_upper <- binom.confint(night, total, method=c("wilson"), conf.level = sigmas[x])[1,6]
  ci_data <- data.frame(step = x, ci_lower, ci_upper)
}

ci_spacing <- lapply(7:1, conf_steps, sigmas=sigmas, night=eq_night, total=eq_total)
ci_steps <- bind_rows(ci_spacing)

layout(matrix(c(1,1,1,2), ncol=4))

par(mar=c(5,6,4,2))
plot(c(min(0.5,floor(100*ci_steps[1,2])/100), max(0.5,ceiling(100*ci_steps[1,3])/100)),
       y=c(-3,8), type="n", bty="n", yaxt="n", ylab="",
       xlab="Proportion of earthquakes at night")
a <- apply(ci_steps, 1, function(x){polygon(c(x[2], x[3], x[3], x[2]),
                                            c(0, 0, 1, 1), col=bands[x[1]], border=NA)})
lines(c(.5,.5), c(0,1), col="#FFFFFF")
lines(c(.5,.5), c(0,1), lty=2, col="#777777")
lines(c(eq_night/eq_total,eq_night/eq_total), c(0,1), lwd=2)

par(mar=c(0,0,0,0))
plot(x=c(0,10), y=c(0,10), type="n", bty="n", axes=FALSE)
legend(0,5.5, legend=lbls, lty=typs, lwd=weights, col=bands, bty="n", xjust=0,
       title="Confidence Intervals:", y.intersp=1.1, cex=0.9)

lbls2=c("50% Night", "Actual Proportion")
typs2=c(2,1)
weights2=c(1,2)
cls2=c("#777777","#000000")
legend(0,7, legend=lbls2, lty=typs2, lwd=weights2, col=cls2, bty="n",
       xjust=0,
       title="Legend", y.intersp=1.2)


par(mar=old_par$mar)
par(mfrow=c(1,1))